Abstract:
We present a set of interactive 3D visualizations, designed to explore oil/gas
reservoir simulation post-processing models. With these visualizations we aim to provide reservoir engineers with better access to the data within their 3D models.
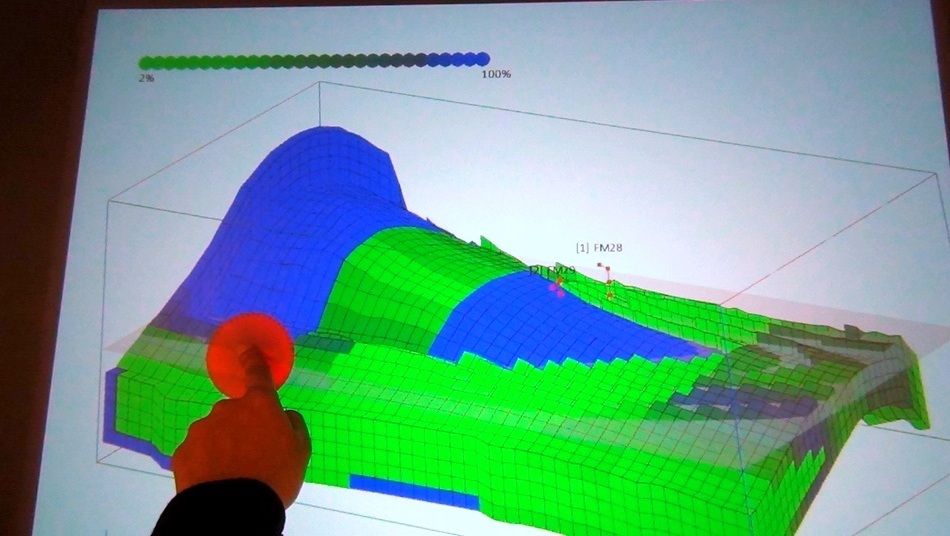
We provide techniques for exploring existing oil well trajectories, and for planning future wells, to assist in decision making.
Our approach focuses on designing visualization techniques that present the necessary details using concepts from information visualization.
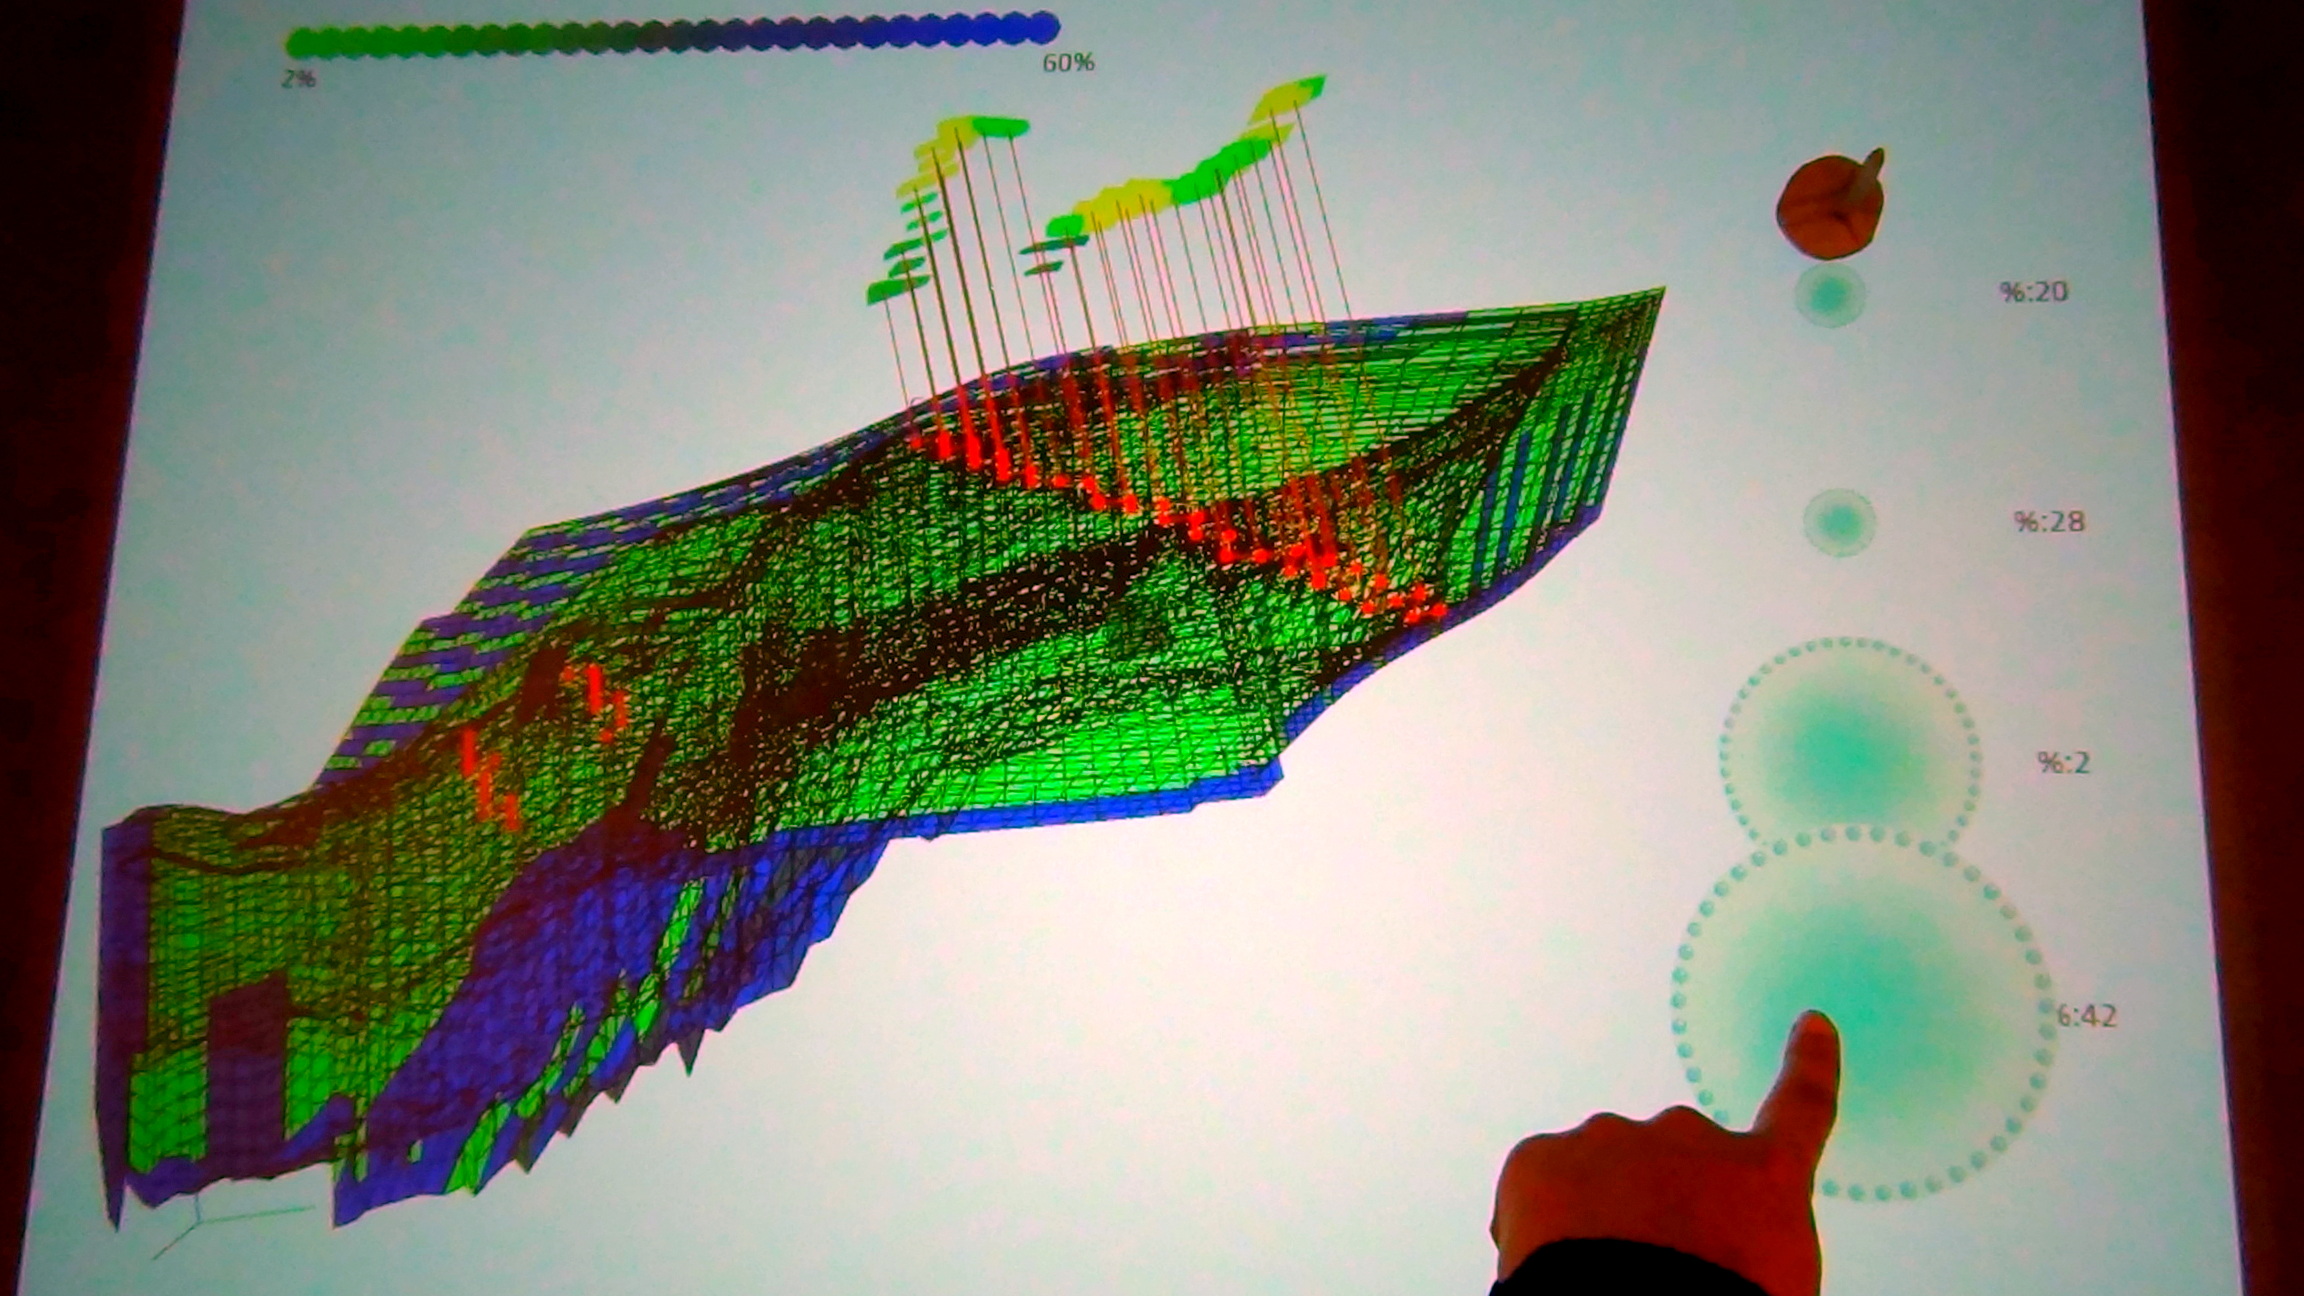
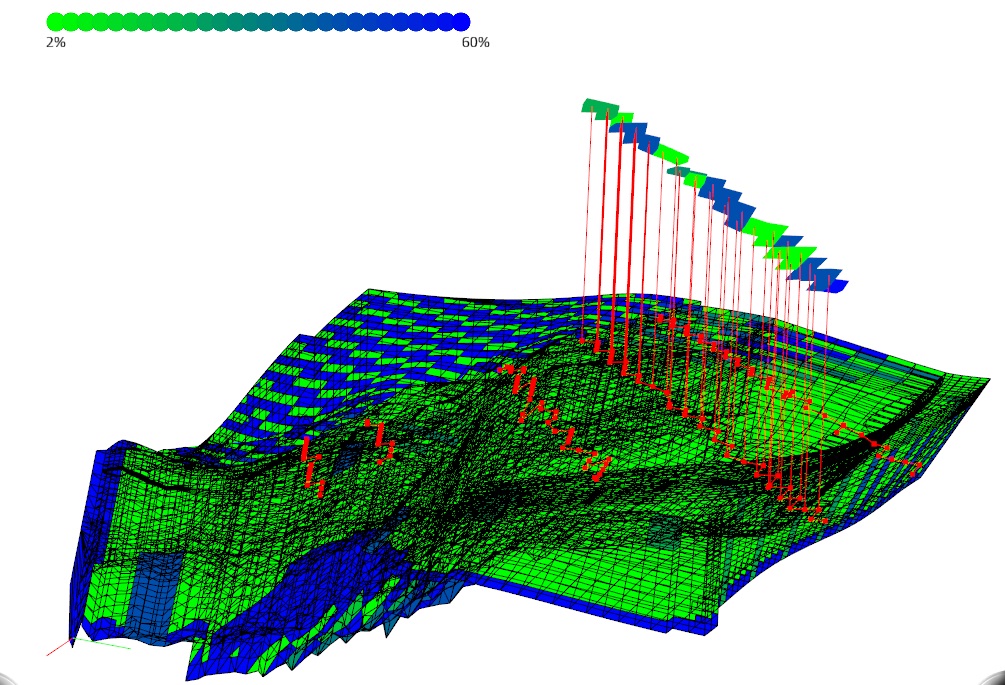
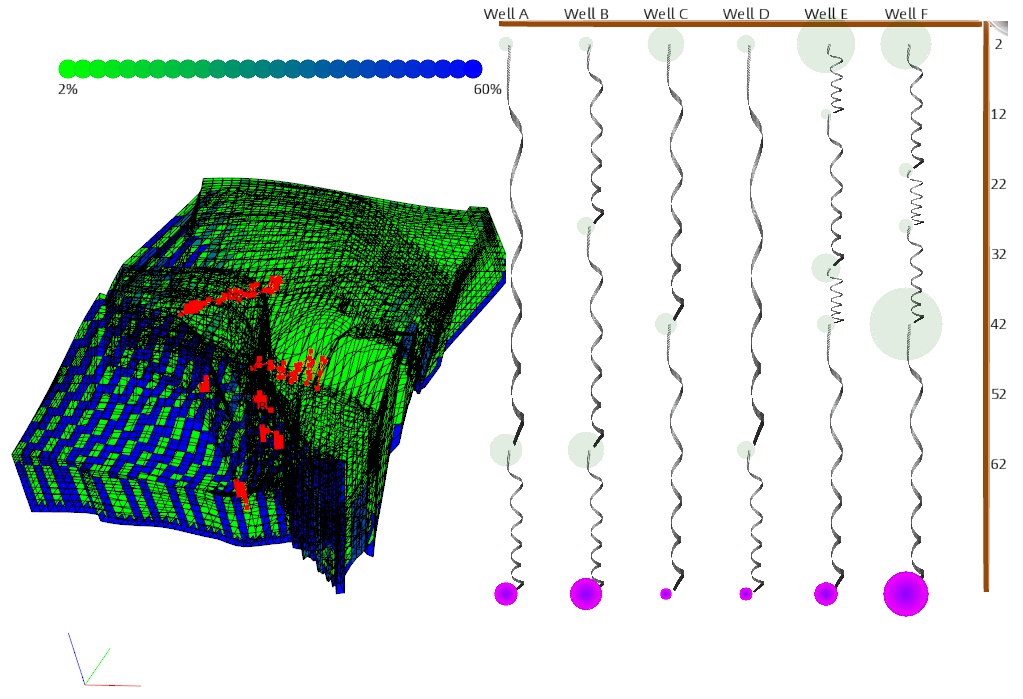
We created three new visualization variations - lollipop-up, information circles and path indicator,which present well trajectory specific information in different visual formats.
Our paper describes these visualizations and discusses them in context of our exploratory evaluation.
Researchers: Sowmya Somanath, Sheelagh Carpendale, Ehud Sharlin, Mario Costa Sousa
-
Publications:
- S. Somanath, S. Carpendale, E. Sharlin and M.C. Sousa, “Information Visualization Techniques for Exploring Oil Well Trajectories in Reservoir Models” , Proceedings of Graphics Interface (GI'14). 2014. Montreal, Canada. (to appear)
- S. Somanath, N. Sultanum, J. Medeiros, E. Vital Brazil, S. Carpendale, E. Sharlin, C.M.D.S. Freitas, E. Mackay, M. Costa Sousa, “Interactive 3D Modeling and Visualization of Well Configurations and Trajectories in Reservoir Simulation Post-Processing”, GeoConvention 2012: Vision, Calgary, Alberta. Extended abstract and poster.
Video:
![]()